


Background
Nursing is a practical field, and as such, clinical practicum embodies a substantial part of the pre-registration nursing courses. Clinical experiences offer realistic prospects for students to gain skills in the actual context and help put theory into practice. Combining cognitive, psychomotor, and affective abilities with the capacity to come up with solutions in a real clinical context presents both achievements and challenges for students (Chan & Ip, 2007). Indeed, to shape nursing students’ skills and boost their self-confidence, a successful clinical education curriculum should focus on giving students a positive and practical learning experience.
There are significant differences between classroom learning and clinical setting because students’ full grasp of theoretical nursing principles does not guarantee their translation into practice (Yazdankhahfard et al., 2020). Unlike organized classroom learning, clinical practice occurs in a dynamic complex social context, which requires high levels of resilience in addition to cognitive, psychomotor, and emotional skills (Chan, 2001). The quality of placement sites has raised suspicions about students’ learning outcomes, and many studies suggest that not all CLE are conducive to learning (Chan et al., 2018). Clinical learning quality depends on many factors, such as applying theory to practice, excellent mentoring, constructive feedback, student integration through effective interpersonal relationships, task orientation, professional leadership, outstanding mentoring, and positive criticism (Tuomikoski et al., 2020). Moreover, impaired interpersonal relationships, a lack of assistance, and challenging learning prospects are some negative experiences that students may undergo (Ten Hoeve et al., 2018). These experiences can vary from one clinical context to another, as clinical education planning may change according to the location or country (Antohe et al., 2016).
The pre-registration nursing program in Morocco includes clinical instruction as a crucial component. Twelve public Higher Institutes of Nursing and Health Techniques (ISPITS) offer a 3-year Bachelor of Nursing. Students obtain the right to practice as registered Nurses after graduating from these institutes. However, as indeed other international nursing institutes, clinical education must be included in the curricula for at least 32 weeks (1,280 hours). Similarly, Moroccan nursing institutes consider the clinical practice a crucial part of students’ professional skills development. This recognition is justified by the overall proportion of credit hours allocated to the internship modules described in the nursing curricula. The amount of actual learning time varies according to nursing specialties (960 hours for family nurse practitioners to 1440 hours for polyvalent nurses). Students spend a significant amount of time in a clinical practicum before becoming staff nurses, where clinical educators help and gradually incorporate them into the nursing profession.
The measurement of the CLE using a validated tool is crucial. Different approaches were used to assess CLE, such as case studies, interaction analysis, and students’ and teachers’ perceptions of the environment’s psychosocial qualities. The CLE assessment from the student’s perspective was adopted because it is cost-effective. Moroccan nursing institutes need efficient tools to assess students’ perceptions of CLE quality. However, there is still a massive lack of knowledge about the Moroccan CLE setting (ElIdrissi et al., 2022; Guejdad et al., 2022).
The CLEI scale was developed from the CUCEI instrument (College and University Classroom Environment Inventory) after being modified for the unique hospital environment (Fraser, 2020). It consists of personalization, student involvement, task orientation, innovation, and individualization subscales. Each subscale is assessed by seven items. In addition, a sixth scale called “Student’s Satisfaction” was utilized by Chan (2002b) as a dependent variable. There are two versions of the CLEI scale, one actual and another preferred form. The two-form items are almost identical, with slight phrasing modifications. While the CLEI appears to be widely used, no previous study has reported a full structural validity of the CLEI scale combining both exploratory factor analysis and confirmatory factor analysis (Chan, 2001; Chan, 2002b, 2003; Chan & Ip, 2007; Ip & Chan, 2005; Midgley, 2006; Newton et al., 2010; Serena & Anna, 2009).
This study examined the psychometric properties of the CLEI scale and its subscales association with Moroccan nursing students’ satisfaction. Therefore, in reference to Chan’s study (Chan, 2001), a research model was conceptualized (Figure 1), and five hypotheses were formulated as follows:

H01: Personalization (PER) has a positive and significant impact on Students’ Satisfaction (SAT).
H02: Involvement (INV) has a positive and significant impact on Students’ Satisfaction (SAT).
H03: Task Orientation (ORI) has a positive and significant impact on Students’ Satisfaction (SAT).
H04: Innovation (INO) has a positive and significant impact on Students’ Satisfaction (SAT).
H05: Individualization (IND) has a positive and significant impact on Students’ Satisfaction (SAT).
Methods
Study Design
A cross-sectional design was conducted between March and June 2022 to validate the CLEI scale and examine the relationships between its subscales and students’ satisfaction.
Samples/Participants
Moroccan undergraduates from three nursing institutes located in three cities (Fez, Meknes, and Taza) in the Fez-Meknes region of Morocco participated in this study. Inclusion criteria were that the participants be nursing students in one of the three-targeted Higher Institutes of Nursing and Health Techniques (ISPITS), be fourth and sixth-semester students, and complete a clinical internship in the semester during which the study took place. Exclusion criteria were students’ enrollment in the second semester during the study; because they had minimal clinical exposure.
The ratio of cases to variables and the strength of the factor analysis results were used to estimate the sample size. The usual rule for the ratio of observations to variables is that there should be at least five times as many observations as variables. These ratios can be lowered if the EFA goal is to evaluate potential structural patterns. To complete the EFA, these recommendations were followed. On the other hand, the communality determines the significance of the variables in explaining each variable, which is relevant to the EFA strength. Accordingly, a sample size of 100 is enough if all the communalities are 0.70 or higher and there are at least three variables that have substantial loadings on each component; however, because the communalities in this study fall between 0.40 and 0.70, the sample size should be at least 200 (Hair et al., 2019). Overall, using convenience sampling, the 35‐item CLEI (version 1) was first piloted with 143 participants, then the modified 31-item CLEI instrument (version 2) was conducted on the second sample of 206 students.
Measures
Clinical Learning Environment Inventory (CLEI) scale
The CLEI instrument was developed by Chan (2001). It consists of 35 items, with seven items for each subscale (Personalization, Student Involvement, Task Orientation, Innovation, and Individualization). The degree to which students choose their own studies and interests is measured by individualization. The ability of clinical educators to provide engaging learning experiences is reflected in innovation. Student involvement gauges how actively they participate in clinical activities. Individual student interactions with educators are highlighted by personalization. However, task orientation evaluates how well-organized the instructions for clinical activities are. The Actual and Preferred formats of the CLEI are available. The preferred form is made to gauge perceptions of the ideal clinical setting, whereas the actual form assesses perceptions of the actual clinical environment. The difference in the two forms’ items’ phrasing is very small. Items in the two forms depict a slight change of wording. With the authors’ express written consent, data gathering for this study used the “Actual” version. Students used a 4-point Likert scale with the options Strongly Agree, Agree, Disagree, and Strongly Disagree to respond to the CLEI scale. Negative items had their scores reversed such that they all pointed in the same direction.
Student’s Satisfaction Scale
In addition to the CLEI, a 7-item questionnaire called Student Satisfaction was also utilized (Chan, 2002b) to gauge how satisfied the students were with their clinical experiences. This scale was used to investigate the relationships between student results and the hospital learning environment. It was created as an outcome measure that indicates the level of student satisfaction.
Demographic Characteristics section
A demographics section representing the respondents’ characteristics was added to the questionnaire.
Translation Process
The CLEI scale and the students’ satisfaction scale were both translated back and forth between English and French (Sousa & Rojjanasrirat, 2011). First, two independent translators who are both competent in English and French translated the text into French. Then, the two versions were compared and adjusted to the Moroccan nursing practice. The first English version was then translated back into French by two separate translators without consulting the original English text. Comparison between the two back-translated versions and the original CLEI English version proved that both the precise meaning of the individual items and the agreement between the two versions had been preserved. Thirty-eight students pre-tested this CLEI version to ensure that it was clear. Following this, minor adjustments and edits were made without substantially changing the statements, resulting in the final French version of the CLEI scale.
Data Collection
Data were collected by distributing paper‐based cross-sectional questionnaires in the clinical areas. During their clinical internship, the students themselves filled out an anonymous questionnaire. Data collection was conducted during March and June 2022 in three nursing institutes located in three cities (Fez, Meknes, and Taza) in the Fez-Meknes region of Morocco. Data was collected by a PhD student in Nursing education, who is also a nurse educator, with the help of her colleagues working in the surveyed institutions.
Data Analysis
Statistical data analyses were performed on the RStudio software 2022.02.3 with packages “psych”, “FactoMineR”, “GPArotation”, “gtsummary”, and “SEMinR”. Exploratory Factor Analysis (EFA) was used to explore the CLEI factorial structure on the first sample (N = 143). Principal axis factoring (PAF) with an oblimin rotation was used as an extraction method. The items with low communalities, significant cross-loading, or unrepresentative loading were removed in a stepwise fashion, and the EFA was rerun after each step. The reliability was assessed by Cronbach’s alpha (CA) coefficient. After checking multivariate normality, the CCA was carried out on the second sample (N = 206) to validate the EFA results using PLS-SEM (Hair Jr et al., 2021). Collinearity, path significance, and effect size were measured for the structural model. The internal consistency and convergent validity were estimated by computing CR and AVE correspondently. When the outer loading value is between 0.4 and 0.7, the choice to keep, change or delete an item rests on item-outer loading, CR, and AVE values. Fornell Larcker criterion and Hetereotrait-Monotrait (HTMT) ratio were used to test the discriminant validity (Hair Jr et al., 2021). Then, a bootstrapping technique was performed to confirm the extent of HTMT confidence intervals (Mohd Dzin & Lay, 2021).
Ethical Considerations
The ethical consideration for this study has been secured. The study permission was also obtained from the heads of the surveyed nursing schools. In addition, before the questionnaires were distributed, informed consent was obtained from both the directors of the surveyed institutes and all participants.
Results
Sociodemographic Characteristics
Three institutions from the Fez-Meknes region of Morocco participated in phases 1 and 2. There were 367 and 364 surveys returned during phase 1 and phase 2, respectively. One hundred forty-three valid survey responses were maintained in phase 1 versus 203 in phase 2 after data screening, cleaning, and eliminating invalid observations. The two samples showed comparable demographic traits. The average age was 20.7 ±1.2 and 20.8 ±1.2 for the first and second samples, correspondently. In addition, 97% of the participants in the first and second phases were Moroccan, and the female gender dominated the two samples (66% vs. 70%). Six nursing branches were surveyed in hospitals (57% vs. 77%) and dispensaries (23% vs. 43%) during the fourth (41-43%) and sixth semesters (51-52%). For both two samples, the polyvalent nurse’s branch (>50%) dominated the other specialties largely, and most of the participants were placed in hospitals (57% vs. 77%) (Table 1).
| Variable | Phase 1, N = 143 | Phase 2, N = 206 |
|---|---|---|
| Student’s age | 20.7 (1.2) | 20.8 (1.2) |
| Nationality | ||
| Foreign | 5 (3.5%) | 7 (3.4%) |
| Moroccan | 138 (97%) | 199 (97%) |
| Gender | ||
| Female | 104 (73%) | 136 (66%) |
| Male | 39 (27%) | 70 (34%) |
| Branch¶ | ||
| ARN | 0 (0%) | 20 (9.7%) |
| CFHN | 24 (17%) | 41 (20%) |
| MHN | 19 (13%) | 13 (6.3%) |
| NM | 2 (1.4%) | 2 (1.0%) |
| NN | 19 (13%) | 27 (13%) |
| PN | 79 (55%) | 103 (50%) |
| Location of higher nursing institutes* | ||
| Fez | 27 (19%) | 76 (37%) |
| Meknes | 63 (44%) | 80 (39%) |
| Taza | 53 (37%) | 50 (24%) |
| Semester | ||
| 2nd Semester | 12 (8.4%) | 10 (4.9%) |
| 4th Semester | 58 (41%) | 88 (43%) |
| 6th Semester | 73 (51%) | 108 (52%) |
| Clinical placement | ||
| Community environment | 61 (43%) | 47 (23%) |
| Hospital | 82 (57%) | 159 (77%) |
Exploratory Factor Analysis Results
First, before conducting EFA, the sampling adequacy (Kaiser– Meyer–Olkin test) and the factorability (Bartlett’s test) of the first sample were estimated. All KMO values for individual items were higher than 0.61, much beyond the permitted limit of 0.60, and the total KMO value was 0.82 (Yong & Pearce, 2013). Bartlett’s test of sphericity (χ2 = 2803.28, df = 465, p <0.000) showed that inter-item correlations were properly large to realize EFA (Taherdoost et al., 2022).
A loading cutoff point of at least 0.40 was initially used. However, items INV14, IND6, IND18, and IND36 depicted communalities less than 0.40 and were thus dropped from the model. With the remaining 31 items, the final five-factor model explained 59% of the overall variation. The five constructs were Personalization (7 items), Involvement (6 items), Task Orientation (7 items), Innovation (7 items), and Individualization (4 items) with eigenvalues of 4.96, 4.15, 3.78, 3.58, and 1.81, correspondently (Table 2).
| Factor/item | Factor loading | Eigenvalue | Variance explained (%) | Cronbach’s alpha | Goodness of fit¶ |
|---|---|---|---|---|---|
| Personalization | 4.96 | 16 | 0.94 | χ2/df = 1.31 | |
| PER1 | 0.85 | RMSEA = 0.04 | |||
| PER7 | 0.80 | TLI = 0.92 | |||
| PER13 | 0.83 | ||||
| PER19 | 0.82 | ||||
| PER25 | 0.82 | ||||
| PER31 | 0.85 | ||||
| PER37 | 0.85 | ||||
| Involvement | 4.15 | 13.4 | 0.89 | ||
| INV2 | 0.75 | ||||
| INV8 | 0.82 | ||||
| INV20 | 0.85 | ||||
| INV26 | 0.70 | ||||
| INV32 | 0.80 | ||||
| INV38 | 0.65 | ||||
| Task orientation | 3.80 | 12.2 | 0.89 | ||
| ORI4 | 0.79 | ||||
| ORI10 | 0.68 | ||||
| ORI16 | 0.73 | ||||
| ORI22 | 0.66 | ||||
| ORI28 | 0.82 | ||||
| ORI34 | 0.72 | ||||
| ORI40 | 0.68 | ||||
| Innovation | 3.58 | 11.6 | 0.91 | ||
| INO5 | 0.74 | ||||
| INO11 | 0.81 | ||||
| INO17 | 0.73 | ||||
| INO23 | 0.80 | ||||
| INO29 | 0.75 | ||||
| INO35 | 0.60 | ||||
| INO41 | 0.87 | ||||
| Individualization | 1.81 | 5.8 | 0.74 | ||
| IND12 | 0.63 | ||||
| IND24 | 0.70 | ||||
| IND30 | 0.60 | ||||
| IND42 | 0.70 |
The constructs’ loadings oscillated from 0.60 to 0.87, demonstrating that all items appropriately measure their respective factors. All factors were highly reliable and well-defined by their items (CA = 0.74 - 0.94). The goodness-of-fit metrics were very satisfactory when using the fit threshold values (χ2/df = 1.31, RMSEA = 0.04, TLI = 0.92) (Finch, 2020).
Partial Least-Squares Structural Equation Modeling
Measurement model: Construct reliability and convergent validity
The construct reliability, convergent validity, and discriminant validity were computed from the measurement model (Hair et al., 2019). We, therefore, analyzed the individual loads (λ) with their respective latent variables (λ ≥ 0.7 is accepted). CCA maintained five factors and discarded two items with lower loading values (INV20 = 0.34 and INO41 = 0.52). The construct reliability was estimated by the outer loading and CR values, while the convergent validity was assessed by the AVE values (Table 3 and Figure 2).
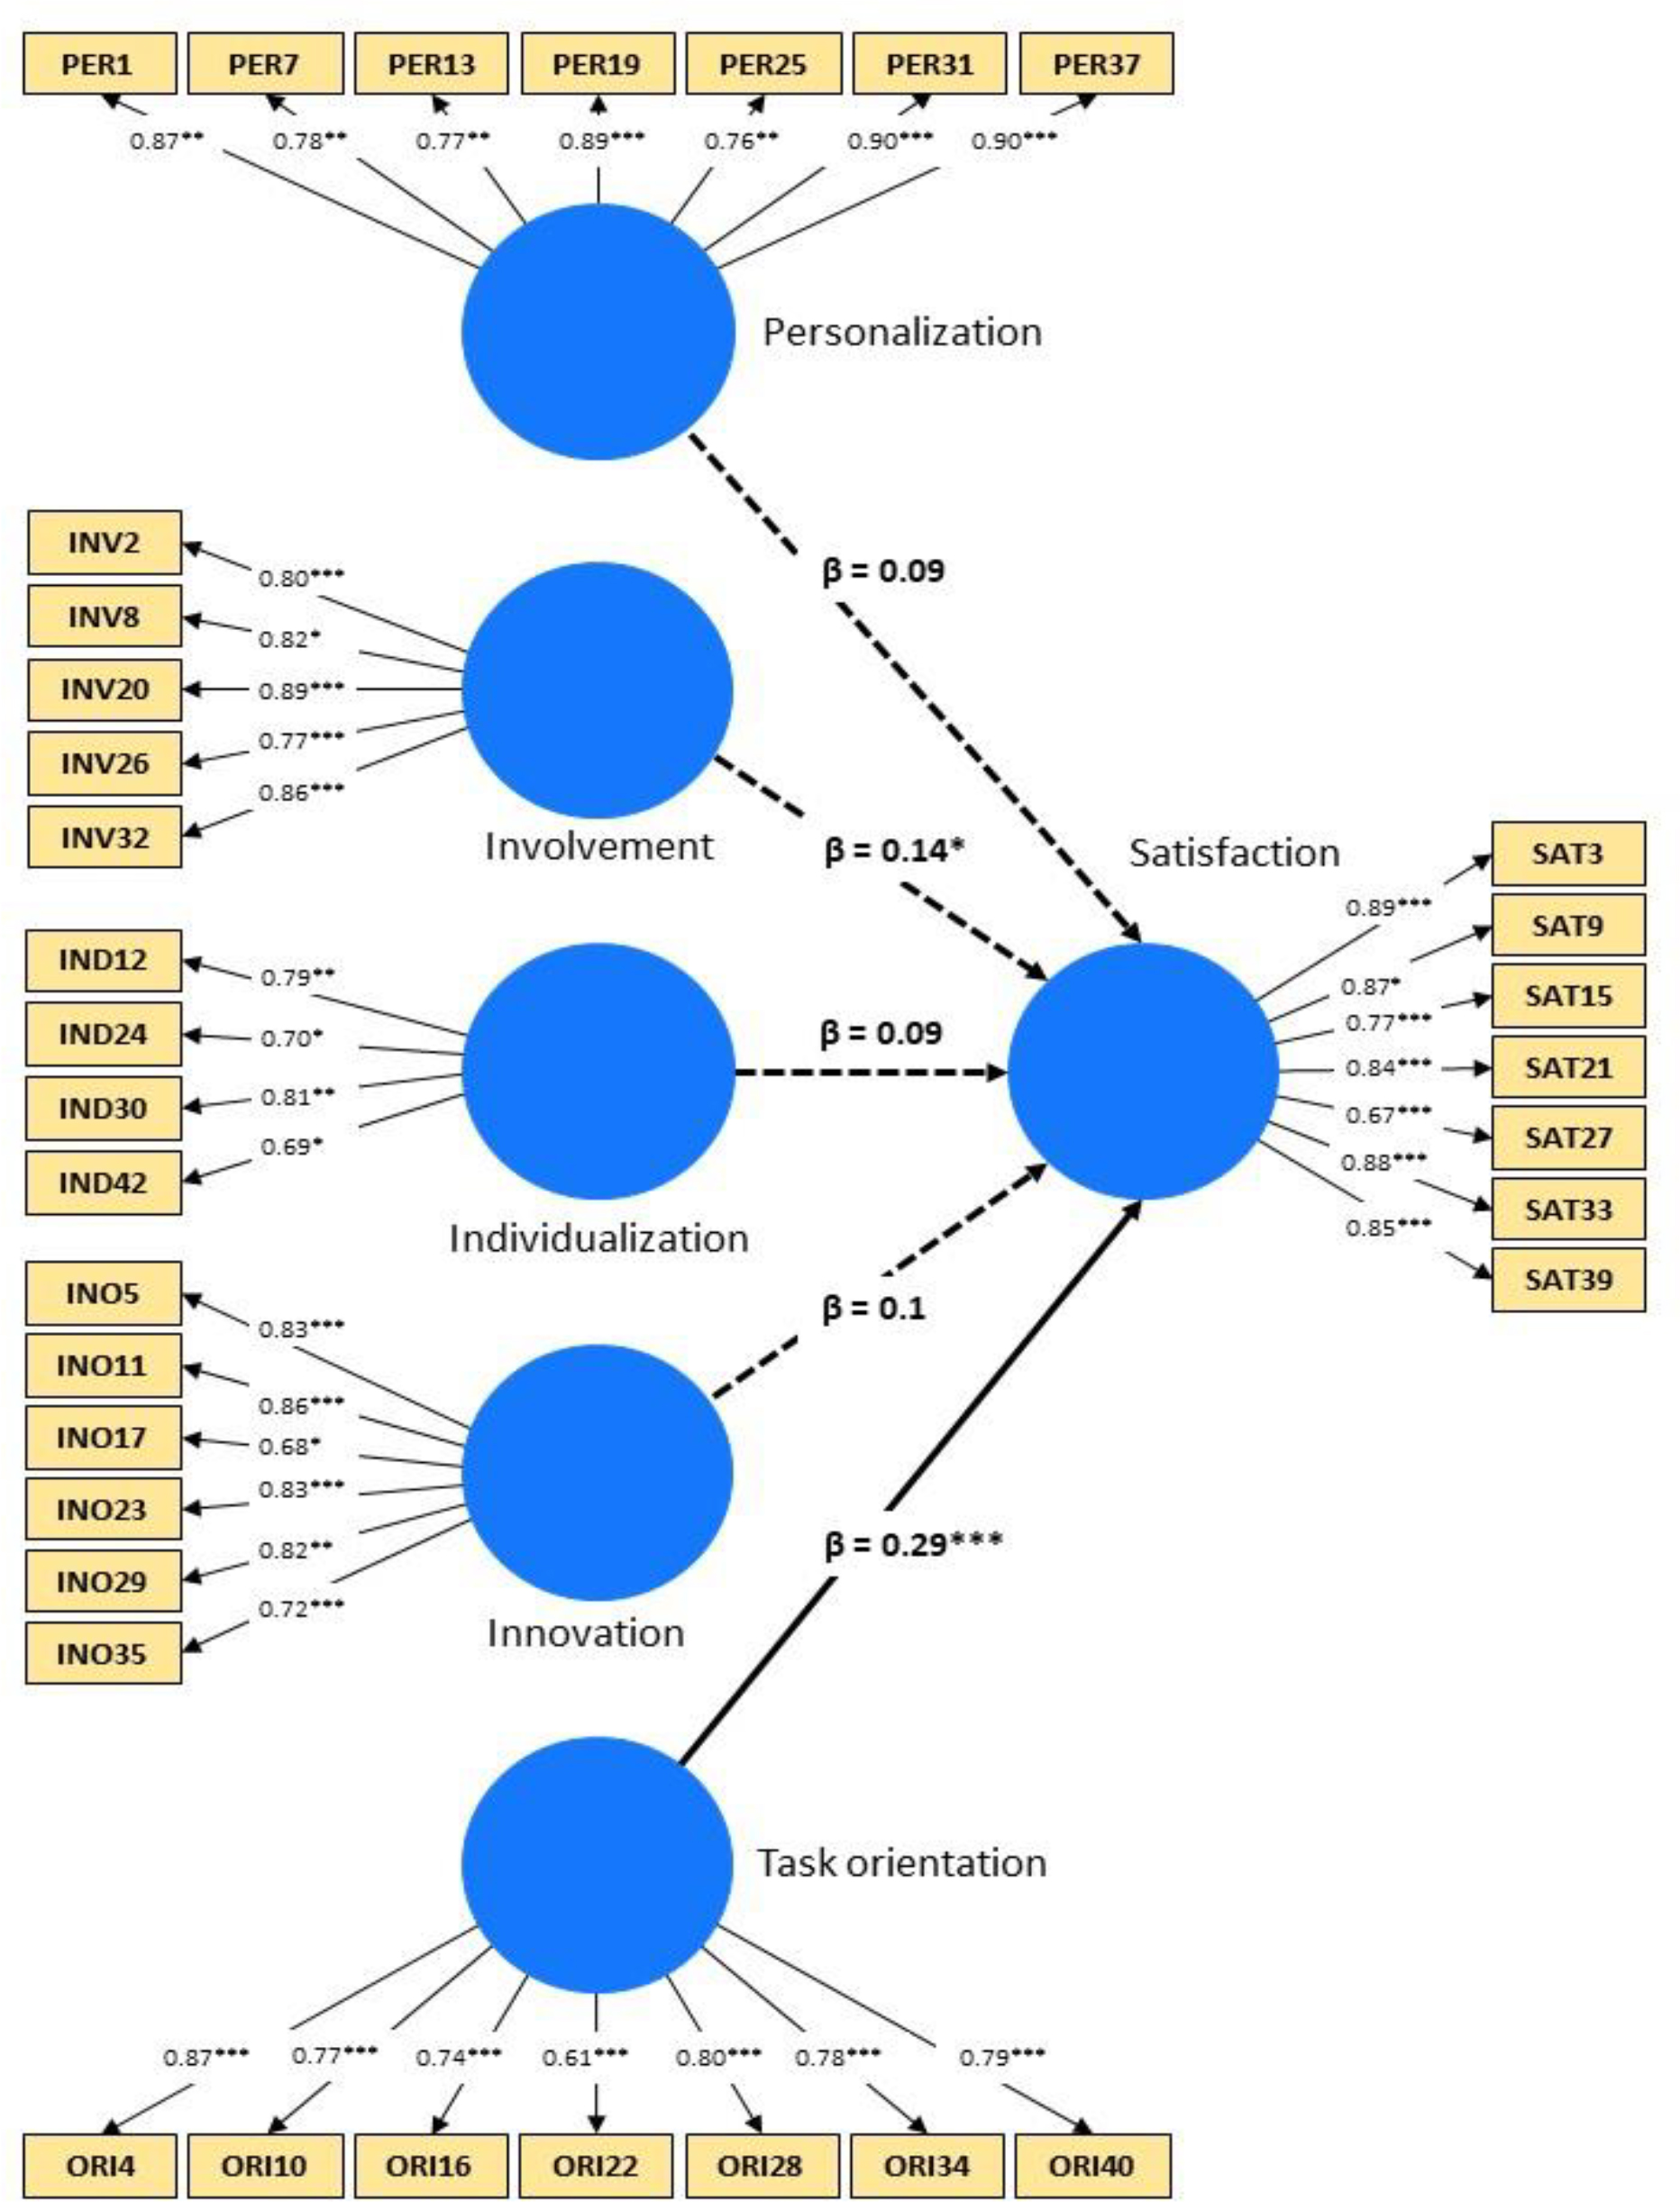
Every indicator below 0.7 crossed the 0.4 level, with ORI22 having the lowest value at 0.61. Whether to keep or delete an item depends on the high outer loadings of the other items and their impact on CR and AVE values when the outer loading is between 0.4 and 0.7 (Manfrin et al., 2019). The reliability coefficient for each of the constructs exhibits sufficient internal consistency of the measures since the CR coefficients for each construct were above 0.70 cutoffs (rhoC= 0.83-0.92). Concerning the convergent validity, the AVE values (0.56 - 0.71) demonstrated that the five constructs had reached the least benchmark of 0.50.
As shown in Table 3, √AVE for each latent variable was higher than all factors matrix correlations, and the highest HTMT value was 0.27 (IND, SAT), below the maximum level of acceptable for HTMT levels. Moreover, the value “1” was not present in the HTMT confidence interval, represented by the values in brackets (Table 4). This demonstrated that the scale being employed had strong discriminant validity (Hair Jr et al., 2020).
| Factor/item | Factors loading | Cronbach’s alpha | Composite reliability (rhoC) | AVE |
|---|---|---|---|---|
| Personalization | ||||
| PER1 | 0.87 | 0.93 | 0.92 | 0.71 |
| PER7 | 0.78 | |||
| PER13 | 0.77 | |||
| PER19 | 0.89 | |||
| PER25 | 0.76 | |||
| PER31 | 0.90 | |||
| PER37 | 0.90 | |||
| Involvement | ||||
| INV2 | 0.80 | 0.89 | 0.91 | 0.62 |
| INV8 | 0.82 | |||
| INV20 | 0.89 | |||
| INV26 | 0.77 | |||
| INV32 | 0.86 | |||
| Task orientation | ||||
| ORI4 | 0.87 | 0.89 | 0.90 | 0.60 |
| ORI10 | 0.77 | |||
| ORI16 | 0.74 | |||
| ORI22 | 0.61 | |||
| ORI28 | 0.80 | |||
| ORI34 | 0.78 | |||
| ORI40 | 0.79 | |||
| Innovation | ||||
| INO5 | 0.83 | 0.91 | 0.88 | 0.63 |
| INO11 | 0.86 | |||
| INO17 | 0.68 | |||
| INO23 | 0.83 | |||
| INO29 | 0.82 | |||
| INO35 | 0.72 | |||
| Individualization | ||||
| IND12 | 0.79 | 0.75 | 0.83 | 0.56 |
| IND24 | 0.70 | |||
| IND30 | 0.81 | |||
| IND42 | 0.69 | |||
| Satisfaction | ||||
| SAT3 | 0.89 | 0.92 | 0.90 | 0.70 |
| SAT9 | 0.87 | |||
| SAT15 | 0.77 | |||
| SAT21 | 0.84 | |||
| SAT27 | 0.67 | |||
| SAT33 | 0.88 | |||
| SAT39 | 0.85 |
| Factor | Fornell–Larcker test | Heterotrait–monotrait ratio (HTMT) [2.5% - 97.5% CI] | |||||||||
|---|---|---|---|---|---|---|---|---|---|---|---|
| F1 | F2 | F3 | F4 | F5 | F6 | F1 | F2 | F3 | F4 | F5 | |
| PER | 0.84 | ||||||||||
| INV | 0.16 | 0.82 | 0.22 [0.11, 0.33] |
||||||||
| ORI | 0.12 | -0.05 | 0.77 | 0.16 [0.12, 0.23] |
0.14 [0.08, 0.22] |
||||||
| INO | 0.22 | -0.17 | -0.15 | 0.79 | 0.25 [0.12, 0.40] |
0.22 [0.11, 0.35] |
0.16 [0.11, 0.30] |
||||
| IND | 0.06 | 0.02 | 0.18 | -0.06 | 0.75 | 0.11 [0.10, 0.23] |
0.17 [ 0.10, 0.25] |
0.23 [0.13, 0.38] |
0.19 [0.13, 0.27] |
||
| SAT | -0.10 | -0.16 | 0.28 | -0.12 | -0.04 | 0.83 | 0.10 [ 0.08, 0.22] |
0.17 [ 0.10, 0.30] |
0.28 [0.17, 0.40] |
0.13 [0.08, 0.24] |
0.12 [0.07, 0.22] |
Structural Model Assessment
All VIF values are lower than five, which ascertained the absence of a multicollinearity effect among CLEI factors (Table 5). The structural model was tested using a resample of 1000 bootstrap samples (Streukens & Leroi-Werelds, 2016). The standardized beta, t-test, p-value, and F square were estimated using the bootstrapping technique, specifying the hypotheses’ results. The direct effects of all the independent variables (PER, INV, ORI, INO, and IND) were considered while determining the impact of various constructs on the dependent variable (student satisfaction). Task orientation showed the greatest direct influence on student satisfaction (β = 0.29, t = 4.94, f2 = 0.10), followed by involvement with a weak negative significant effect (β = -0.14, t = -1.96, f2 = 0.02). Thus, task orientation might be the most important element influencing the students’ satisfaction in CLE. The beta value of 0.29 suggests a 29% variation in nurse students’ satisfaction explained by the ORI subscale. Meanwhile, PER, INV, INO, and IND showed no significant relationship with students’ satisfaction (f2 = 0.01). This gives support for the H01, H02, H04, and H05 hypotheses but fails to support the H03 hypothesis.
| Hypotheses | β | 2.5% - 97.5% CI | t-value | p-value | f2 | Effect size | VIF | |
|---|---|---|---|---|---|---|---|---|
| H01 | PER→SAT | -0.09 | -0.28, 0.21 | -0.70 | 0.24 | 0.01 | No effect | 1.13 |
| H02 | INV→SAT | -0.14 | -0.27, 0.00 | -1.96 | 0.03* | 0.02 | No effect | 1.10 |
| H03 | ORI→SAT | 0.29 | 0.17, 0.40 | 4.94 | 0.001*** | 0.10 | Small | 1.07 |
| H04 | INO→SAT | -0.10 | -0.27, 0.25 | -0.65 | 0.26 | 0.01 | No effect | 1.14 |
| H05 | IND→SAT | -0.09 | -0.25, 0.13 | -0.88 | 0.19 | 0.01 | No effect | 1.03 |
Discussion
The CLEI reliability was examined using CA and CR, which were computed from EFA and PLS-SEM models. The convergent validity was examined using cross-loadings and AVE, while the discriminant validity was tested by the Fornell-Larcker and Heterotrait-Monotrait tests. All the subscales indicated acceptable CA values, ranging from 0.74 to 0.94, in agreement with previous studies (Chan, 2001, 2002a). The CR of the scale, estimated by computing rhoC, revealed that all the values lie above the standard value of 0.7, which reflects good reliability. Moreover, the levels of internal consistency are higher than those found in a previous study (Woo & Li, 2020). Of note, none of these previous studies, including those of Chan (2002b), has examined the factorial dimensions of the CLE scale using SEM techniques. In addition, very few studies reported factorial analysis of the CLEI scale, but surprisingly they computed CA from factors loadings as a test of reliability (Ergezen et al., 2022; Hudacek et al., 2019). However, contrary to CR, the CA coefficient does not take into consideration the varying factor loadings of the items. Thus, it is no longer warranted to rely solely on CA as a reliability indicator (McNeish, 2018).
The main purpose of this study was to validate the CLEI scale in the Moroccan context following Chan’s scale structure, which considered the satisfaction scale the dependent variable (Chan, 2002a). Then, the five-factor scale was extracted through EFA and validated using a PLS-SEM approach because of the non-normal distribution and the sample size (Hair Jr et al., 2021).
Interestingly, the results showed that a PLS-SEM using CCA generated the best model fit in terms of factor loadings for this version of the CLEI scale. The scale’s developing structural model was then verified using a Bootstrapping analysis approach. The current scale version showed good structural model fit characteristics and convergent and discriminant validity. However, Chan’s study (Chan, 2003) assesses the scale validity using only items and factor correlations. However, these first-generation methods are criticized due to the assumption that every variable is observable, error-free, and has a simple model structure (Hair et al., 2019).
Associations between the satisfaction subscale and the CLEI-five subscales were investigated using PLS-SEM path analysis. The associations were not significant between students’ perceptions of personalization, innovation, and individualization, and their level of satisfaction, while there was a slightly and strongly significant association, respectively, for involvement and task orientation. Nevertheless, students who placed high importance on task orientation in their clinical environment reported much higher student satisfaction (β = 0.29, p <0.001). These results are partly in agreement with those of Chan (2002b), reporting that students who gave task orientation, involvement, individualization, and innovation a high priority in their clinical placement experienced significantly higher satisfaction levels (β = 0.17-0.37). The latter demonstrated that student satisfaction is significantly greater in students who highly valued task orientation, involvement, individualization, and innovation in their clinical placement (β values ranged from 0.17 to 0.37). Whereas, and in congruence with our findings, they showed the highest standardized path coefficient of direct effect from Task Orientation to students’ satisfaction (β = 0.37, p <0.001). This ascertains that nurse students put more emphasis on the importance of task orientation, which reflects the extent to which guidelines for clinical activities are well planned. Several studies on this topic confirmed that many nursing students found clinical experiences to be anxiety-inducing and frequently felt exposed to these settings due, in part, to the lack of clear instructions given to students (Kushnir et al., 2014). Therefore, clinical educators must examine how vulnerable nursing students are on the clinical wards as a potential means of lowering their anxiety (Chan, 2002a).
On the other hand, and in agreement with a previous study (Henderson et al., 2012), no association had been demonstrated between innovation and student satisfaction. This pleads in favor of possible students’ disinclination towards innovation, which may indicate that educators adopt a teacher-centered approach rather than a student-centered approach (Abualhaija, 2019). In addition, these findings are in dissonance with those of Chan (2002b) concerning other construct associations. This could be attributed to the caveats that underlie the first-generation multivariate methods used by previous studies, including multiple regression analysis. The latter assumes a simple model structure involving one layer of dependent and independent variables that can only be estimated piecewise rather than simultaneously with SEM, which could, subsequently, distort the quality of the result (Sarstedt et al., 2020).
Additionally, since students’ perceptions may fluctuate depending on the unique traits of each country, various factorial designs might reveal cultural variations through different settings. For instance, Moroccan students might be less sensitive to authorities compared to European people (Ciavolino et al., 2022; Mohammadi et al., 2020). This might explain why Moroccan students did not place much emphasis on the personalization dimension when compared to previous studies (Chan, 2001). But this does not exclude the positive impact of interpersonal relationships between clinical ward participants on the students’ outcomes (Ergezen et al., 2022).
Limitations
The study was carried out in one Moroccan region with a sample size that did not include all the wards’ students. This limits its generalizability across the country’s subpopulations. In addition, the participants were enrolled in diverse clinical settings from three different areas, which vary broadly in terms of infrastructure and the quality of supervision. So, combining these differences in one sample could bias the results because some had especially positive experiences, compared to perhaps negative ones for others. Moreover, it seems necessary to investigate both CLEI scale forms (actual and preferred versions) to effectively address students’ expectations.
Implications of the Study
CLEI was specifically developed to define the learning environment constructs. With an emphasis on individualization, innovation, involvement, personalization, and task orientation, this conceptual model investigated the predictability of students’ cognitive and attitude outcomes. The main purpose of this work was the investigation of the CLEI-scale validation in the Moroccan context following Chan’s scale structure and the relationships between students’ satisfaction and each CLEI construct. Indeed, the scale was validated, and the students’ satisfaction seems to be more impacted by the task orientation subscale than other subscales. This study raises the question of the pedagogical skills of nurse educators in CLE. These aspects were not explored in this work but should be investigated further by a qualitative study. Therefore, the implications of our findings are multifold. First, a Moroccan version of the CLEI Scale has been psychometrically investigated for further extensive use in Morocco. This is of paramount importance because the studied scale could fill a complete lack of valid instruments to gauge the CLE in Moroccan wards. Second, this widely used scale has been thoroughly explored for the first time by the PLS-SEM techniques, which sheds new light on the psychometric characteristics of Chan’s conceptual model.
Conclusion
The results of this study reflect the prior work of Chan (2001) in terms of the psychometric properties of the CLEI scale. Task orientation was found to be strongly connected with students’ levels of satisfaction following their clinical placement. Consequently, the students showing high expectations for task orientation demonstrated a highly positive perception of their clinical placement outcome. Contrary to other cultural backgrounds, personalization, involvement, innovation, and individualization subscales showed insignificant direct effects on the students’ satisfaction in the Moroccan context. Therefore, it is of paramount importance that clinical educators tailor their instructions to the students’ needs to enhance learning and reduce anxiety in clinical settings. Overall, this study is the first to use SEM techniques to validate the CLEI instrument in Moroccan clinical wards. Furthermore, because this short CLEI version is a rapid, accurate, and reliable tool for evaluating CLE, nursing facilitators may use it to assess student outcomes and improve clinical supervision.